
[kc_row use_container=”yes” force=”no” column_align=”middle” video_mute=”no” _id=”692205″][kc_column width=”12/12″ video_mute=”no” _id=”572572″][kc_column_text _id=”840343″]
LIVING WITH MORE POLLUTION AND INEQUALITY IN LIVING COLOR
Air pollution is the single largest environmental health risk facing humankind, according to the World Health Organization. Air pollution alone causes more than 200,000 deaths each year in the United States. Place matters. In the real world, some people and places don’t matter. Discriminatory policies and unequal power arrangements place people of color and the poor at elevated risks from waste and industrial facility siting, health threats from risky technologies, and increased vulnerability from natural and human-made disasters, including elevated threats from global warming and climate change. The most vulnerable and marginalized populations and communities shoulder the greatest health, environmental and economic risks. Listed below are selected resources that present color maps, illustrations, animations, interactive infographics and tools on a range of environmental and climate justice and health equity issues.
UNEQUAL POLLUTION BURDEN AND HEALTH INEQUALITY
Our Nation’s Air 2018, U.S. Environmental Protection Agency, August 1, 2018)
Living in a poor neighborhood changes everything about your life, Alvin Chang, Vox April 4 2018.
This is how much of your life air pollution is stealing from you based on where you live, Echo Huang, Quartz September 11, 2017.
Animated map shows the best states to live for your well-being, Business Insider, YouTube March 21, 2017.
How healthy are people where you live and why?, Ann Wolfe, Clarion Ledger, March 15, 2018.
Mapping life expectancy, Virginia Commonwealth University Center for Society and Health and Robert Wood Johnson Foundation, September 26, 2016.
Satellite data improves exposure estimates, Stephanie Smith-Roe, NIEHS Environmental Factor, July 2018.
EPA launches mobile app for EJScreen: New tool more accessible for community work, US EPA, Office of Policy, April 24, 2018.
State of the Air 2018: Most polluted cities, The American Lung Association, 2018.
The most (and least) toxic places in America, Priceconomics Forbes, November 7, 2017.
16 maps that’ll change how you see New York City, Harry Bradford, Huffington Post, December 6, 2017.
Comparing tree cver with income levels, Ted Mellnik and Annue Gowen, The Washington Post, April 25, 2013.
Trees: A shared good with unequal access, Smart Cities Dive, Deeproot, 2016.
Food Access Research Atlas, USDA Economic Research Service, May 18, 2017.
It’s not the food desert: It’s the inequality, Richard Florida, CityLab, June 18, 2018.
Hunger transcends geography in the U.S., Tanvi Misra, CityLab, April 29, 2016.
Map the Meal Gap Report 2018: Food Insecurity in the United States. Feeding America, 2018.
Food Deserts in America (Infographic), Tulane University School of Social.
A digital window into the roofs of redlining, Tavi Misra, CityLab, October 17, 2016.
These 5 neighborhood maps show roots of gentrification, Oscar Perry Abello, Next City, August 1, 2017.
Race, gentrification and health in Philadelphia, Richard Florida, City Lab, February 21, 2017.
The closest look at gentrification and displacement, Richard Florida, City Lab, November 2, 2015.
The link between walkable neighborhoods and race, Richard Florida, City Lab, May 22, 2015.
Going for a walk is not as healthy as you think if you’re strolling on pollutes streets, Najja Parker Atlanta Journal Constitution, December 7, 2017.
2.9 million children are threatened by toxic air pollution from oil & gas development, Moms’ Clean Air Force, Ecowatch, September 27, 2017.
Even breathing is a risk in one of Orlando’s poorest neighborhood, Julia Cravens Huffington Post, January 23, 2018.
Air pollution from industrial shutdowns and startups worse than thought, Nikolaos Zirgiannis, Alex J. Hollingsworth, and David Konisky, The Conversation February 14, 2018.
Premature birth rates drop in California after coal and oil plants shut down, Sabrina Shankman, Inside Climate News, May 22, 2018.
Air pollution: Black, Hispanic and poor students most at risk from toxins – study, Oliver Milman, The Guardian, February 1, 2018.
GLOBAL ENVIRONMENTAL JUSTICE
Tracking the battles for environmental justice: here are the world’s top 10, Julie Snorek, The Conversation, June 4, 2018.
The Global Environmental Justice Atlanta (EJAtlas): Ecological distribution conflicts as forces for sustainability, Leah Temper, Federico Demaria, Arnim Scheidel, Daniela Del Bene, and Joan Martinez-Alier, Sustainability Sciences, 13 (3) May 2018.
WHO Global Ambient Air Quality Database (update 2018), World Health Organization, May 2, 2018.
Air quality is leading environmental threat to public health: Switzerland tops the report while India faills to the bottom tier, Yale University Environmental Performance Index (EPI) Science Daily, January 23 2018.
CLIMATE CHANGE AND CLIMATE JUSTICE
Assessing the U.S. Climate in January 2018, National Center for Environmental Information, NOAA, January 2018.
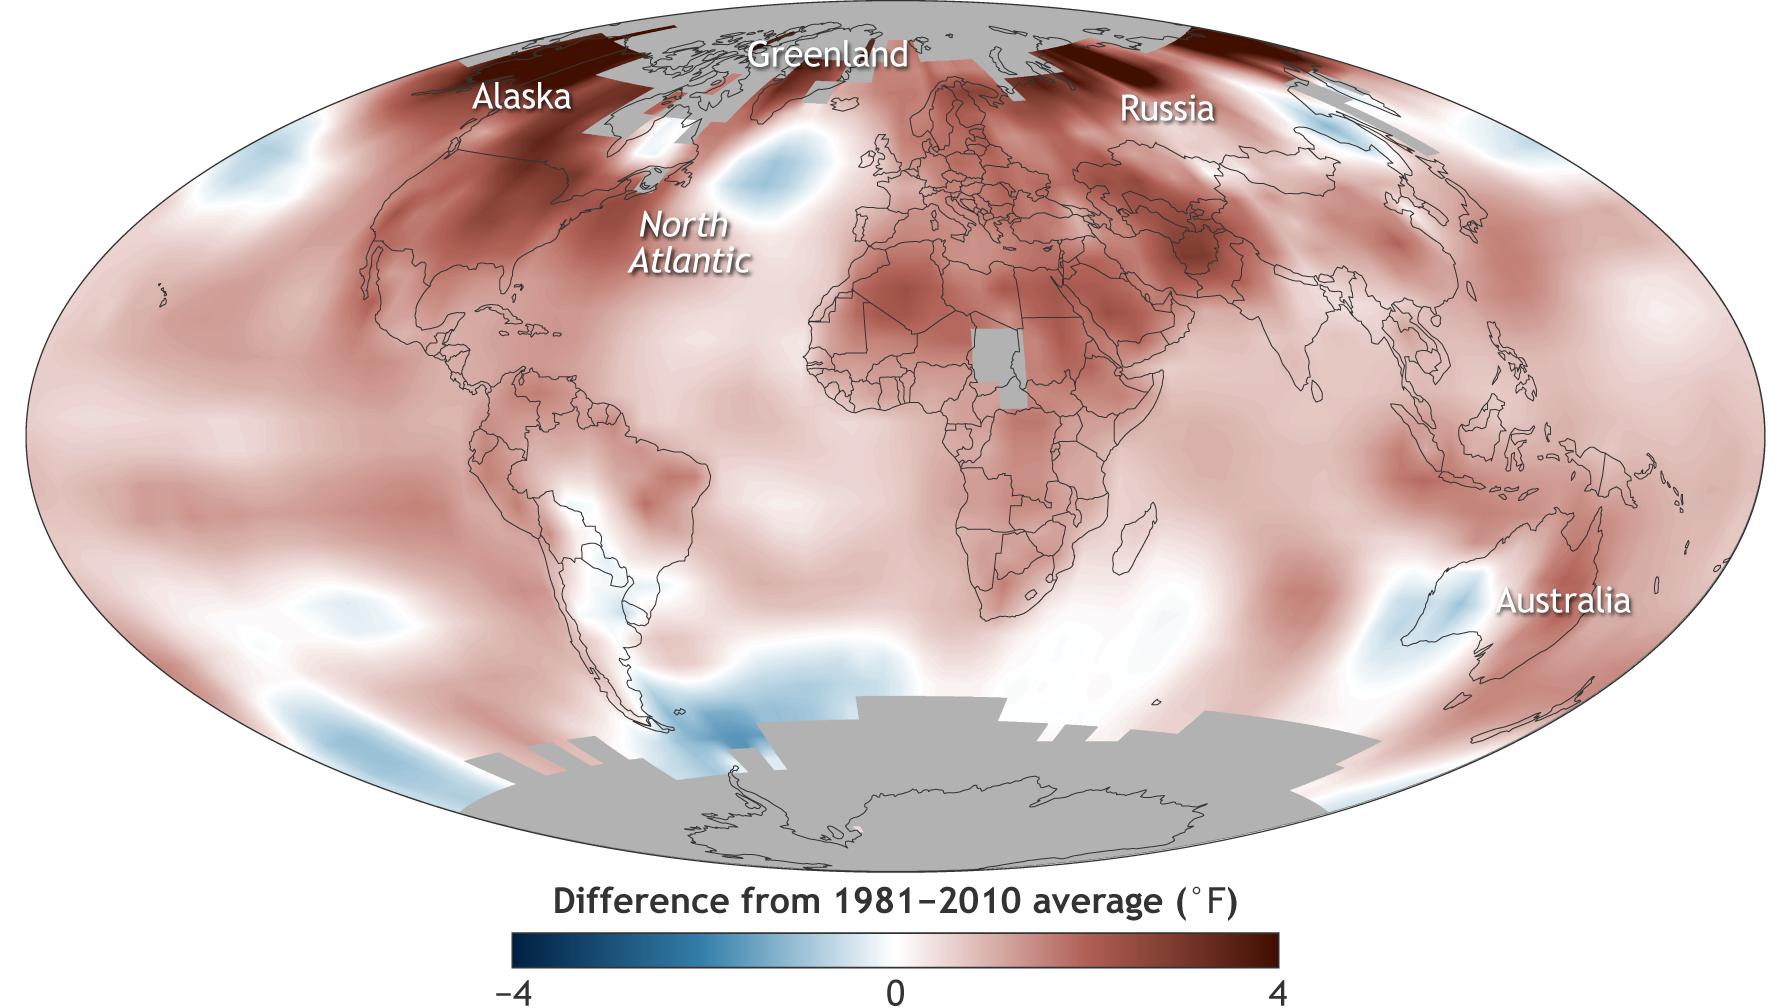
Climate change: Global Temperature, LuAnn Dahlman, NOAA, September 11, 2017.
Watch 130 years of climate change, The Weather Channel, YouTube, January 24, 2013.
Surging Seas Risk Finder: Explore sea level and coastal flood levels, Climate Central, 2012.
Surging seas: Mapping choices, Climate Central, 2012.
States at risk, Climate Central, 2015.
Sea level rise viewer tool, NOAA Office of Coastal Management, June 26, 2018.
Scientists have found a perfect illustration of how the climate is spiraling ‘out of control’ Chelsea Harvey, Washington Post, July 28, 2016.
Climate spirals, Ed Hawkins, Climate Lab Book, 2017.
The temperature spiral has an update : It’s not pretty, Brian Kahn, Climate Central, May 31, 2016.
Climate warming stripes, Ed Hawkins, Climate Lab Book, May 22, 2018.
Watch the climate change in real time with these trackers, Umair Irfan, Vox, June 30, 2018.
The U.S. had the warmest May in history, blowing past 1934 Dust Bowl record, Jason Samenow, Washington Post, June 7, 2018.
New map reveals which countries are most likely to survive climate change, Fran Whittaker-Wood, Alternet, February 11, 2018.
Guest post: Exceeding 1.5C of global warming will hit poorest the hardest, Andrew King and Luke Harrington, Carbon Brief, May 29, 2018.
Green islands for all? Avoiding climate gentrification in the Caribbean, Jennifer Adams, Crystal Fortwangler and Hadiya Gidney Sewer, Society of Ethnobiology, October 19, 2017.
Climate gentrification will deepen urban inequality, Richard Florida, City Lab, July 5, 2018.
Climate gentrification in Miami and what that can teach us about rebuilding Houston, America Adapts, Daily Kos, August 28, 2017.
These U.S. cities are most vulnerable to major coastal flooding and sea level rise, Climate Central, October 25, 2017.
Underwater: Rising seas, chronic floods, and the implications for the US coastal real estate, Union of Concerned Scientists, July 27, 2017.
Rising seas: “Florida is about to be wiped off the map, Elizabeth Rush, The Guardian, June 26, 2018.
What land will be underwater in 20 years? Figuring it out could be lucrative, Brad Plummer, The New York Times, February 23, 2018.
7 major U.S. cities could be underwater within 80 years- here are the disturbing ‘after ‘ images, Melia Robinson, Business Insider, July 18, 2017.
Miami faces an underwater future, Carolyn Kormann, The New Yorker, July 3, 2018.
National landmarks at risk, Union of Concerned Scientists, May 2014.
Climate change is the national parks’ biggest challenge, Climate Central, 2016.
Sea level rise and storm surge projections for the National Park Service, M.A. Caffrey et al., National Park Service Report Series NPS/NRSS/NRR—2018/1648, May 2018.
National parks could face flooding from sea level, storm surge, Stephanie Ebbs, ABC News, May 21, 2018.
FEMA has radically underestimated how vulnerable Americans are flooding, David Roberts, Vox, March 3, 2018.
Before and after Hurricane Harvey in satellite photos, Fernando Ramirez, Houston Chronicle, May 1, 2018.
Maps provide new insights into the level of destruction caused by Hurricane Harvey, Fernando Alfonso III, Houston Chronicle, May 11, 2018.
How victims, local officials and an aloof FEMA put flooded homes back in harm’s way, Mark Collette, Houston Chronicle, July 5, 2018.
ENERGY
Analysis: Every one of America’s 57,636 wind turbines, mapped, Christopher Ingraham, Washington Post, May 11, 2018
2018 solar power rocks: Report grades every state on solar friendliness, Steve Hanley, Clean Technica, February 14, 2018.
Where America’s poor pay the most for electricity, Julian Spector, City Lab, April 14, 2016.
[/kc_column_text][/kc_column][/kc_row]
